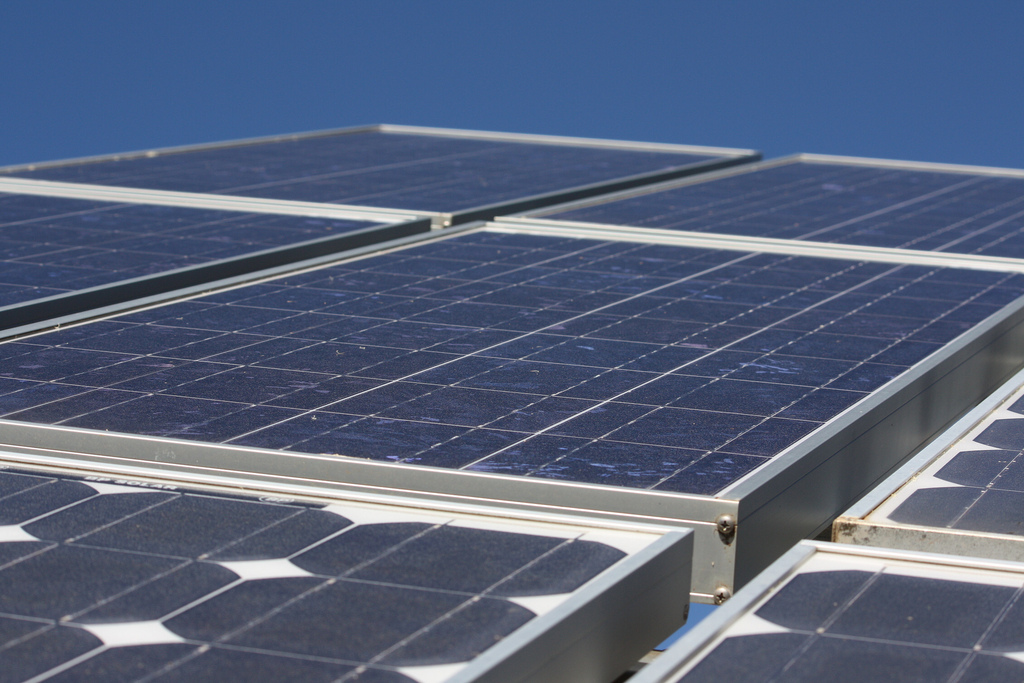
Photo by Mountain/ \Ash, CC BY 2.0
This is the 15th installment of Construction Junkie's weekly analysis of the hourly wages of each individual construction profession by state. The three previous professions we examined were window glaziers, sheet metal workers, and building inspectors. You can also see the full list of all past and future professions by clicking here.
The solar photo-voltaic panel installation profession is one of the newest jobs on the construction site. It's also considered by the Bureau of Labor Statistics (BLS) to be one of the fastest growing professions across any industry. From 2016 to 2026, the BLS expects employment to rise 105 percent, when the average is only around 5 percent.
As solar cells are getting lighter, more powerful, and cheaper by the day, homeowners and companies alike will continue to harness the sun's energy more and more. Tesla also helped push the solar industry forward again last year, with their release of their solar roof shingles, which mimic the look of a traditional roof.
Below you'll find a breakout of how each state compensates their solar panel installers. As you'll see, there is only data from 18 states currently, as the profession is still in its relative infancy. All data below comes from the BLS' most recent reports from May 2016.
Graph of Average Hourly Wage of Solar Panel Installers, by State
click for larger image
Rankings of Average Hourly Wage of Solar Panel Installers, by State
18. Missouri -- $15.46/hour
17. Florida -- $15.66/hour
16. North Carolina -- $16.48/hour
15. Vermont -- $17.46/hour
14. Ohio -- $17.79/hour
13. New Mexico -- $17.89/hour
12. Connecticut -- $18.71/hour
11. New York -- $19.79/hour
10. Oregon--$19.81/hour
9. Arizona -- $20.88/hour
8. Texas -- $20.88/hour
7. California -- $21.82/hour
6. New Jersey -- $21.86/hour
5. Massachusetts -- $22.18/hour
4. Colorado -- $23.26/hour
3. Nevada -- $23.81/hour
2. Hawaii -- $25.46/hour
1. Utah -- $27.70/hour
Graph of Average Hourly Wage of Solar Panel Installers - Adjusted for Cost of Living, by State
Cost of living in each state also has a large impact on the amount of money construction trades actually bring home, so the graph below shows each state's adjusted hourly wage based upon the cost of living index for that state. All cost of living index data comes from the Missouri Economic Research and Information Center and was last updated for the second quarter of 2017. The cost of living index was based upon grocery, housing, utilities, transportation, health, and miscellaneous costs for each state.
click for larger image
Rankings of Average Hourly Wage of Solar Panel Installers- Adjusted for Cost of Living, by State
18. Hawaii -- $8.55/hour
17. California -- $11.87/hour
16. Oregon -- $13.53/hour
15. New York -- $13.54/hour
14. Massachusetts -- $15.42/hour
13. Connecticut -- $15.62/hour
12. Florida -- $15.89/hour
11. New Jersey -- $16.94/hour
10. Vermont--$16.95/hour
9. Missouri -- $17.02/hour
8. North Carolina -- $17.37/hour
7. New Mexico -- $18.95/hour
6. Ohio -- $19.16/hour
5. Arizona -- $21.61/hour
4. Nevada -- $22.52/hour
3. Colorado -- $22.59/hour
2. Texas -- $22.84/hour
1. Utah -- $29.00/hour


In the midst of fierce discourse over the bipartisan infrastructure bill lies a unique opportunity for the United States.